Power BI User Interface Walkthrough
This series walks through the Power BI user interface from start to finish, showing how the different parts of Power BI fit together. It begins with preparing data in Power Query, then moves into the main Power BI Desktop workspace, building and managing visuals, using panes and the ribbon, and finally tying everything together with key takeaways. The goal is to help users feel oriented, confident, and productive inside Power BI—so the tool supports the work, instead of getting in the way.
User Interface Walkthrough: Power Query
Power Query is where data is brought into Power BI and cleaned before any reporting begins. It lets you connect to data sources, shape and transform data, and apply repeatable steps that automatically refresh with new data. Getting things right in Power Query makes everything else in Power BI easier and more reliable.
User Interface Walkthrough: Power BI Main Window
The main Power BI window is the central workspace where reports are built. It includes Report View for creating visuals, Data View for inspecting tables, and Model View for managing relationships. Understanding these views helps users move confidently through the Power BI workflow.
User Interface Walkthrough: Working with Visuals & Pane Switcher
The pane switcher controls access to Visualizations, Fields, and Filters. These panes are used to build visuals, assign data fields, and control how data is filtered at the visual, page, or report level. Mastering these panes makes creating and adjusting visuals much faster.
User Interface Walkthrough: Power BI Ribbon
The ribbon contains key commands for building, formatting, and publishing reports. It changes based on what is selected, showing only relevant options. While not everything is needed at once, the ribbon becomes a powerful time-saver as users gain experience.
User Interface Walkthrough: Takeaway Lesson
Power BI’s interface is designed to support each stage of the reporting process, from data preparation to visualization. Users don’t need to learn everything at once—confidence comes from understanding how the pieces fit together and using them as needed.

Zero to Power BI Pro: The 5-Step Framework to Career Success

Power BI, thank you 🙏. Seriously, I’m so grateful for the life I get to live today—flexibility, freedom, and fulfilling work I love.
This article lays out the 5 key steps that you can follow too, to become a Power BI Pro and build your own life of freedom 🕊️.
My Journey to Power BI Pro
My Journey to Power BI Pro
I get to work with amazing clients and students from all over the world. I earn a great income doing work I actually enjoy. And best of all? I get to do it completely on my terms. I choose how I work, when I work, and where I work. That means I get to take vacations, hang out with my kids, and live life without the constant grind.
And here’s the thing: I talk to a lot of folks who want something similar. They ask me things like, “How do I land a job with Power BI?” “How can I grow in my current role?” or “How do I start getting clients and become a consultant?”
These are exactly the right questions. Because let’s face it—no one’s coming to save your career. You’ve got to be the CEO of your own career. The captain of your own ship.
But I get it—it can feel like a big leap. Maybe even impossible. Like that kind of success is only for other people (That’s how I used to feel). But I’m here to tell you: it’s absolutely possible. For you. Whether you want to be a consultant or just be more valuable as an employee, it all comes down to taking step-by-step action.
The key is to break it down. One step at a time. Most people either never get started, or they miss some key steps along the way—and that’s what causes them to stall or get stuck.
So that’s what this article is about. These are the five steps you need to take. Step by step. And if there’s one step people miss the most? It’s Step 3. Step 4 and Step 5 are built on top of it. So if you miss Step 3, you miss the chance to build real momentum.
Let’s break it down.
Step 1: Learn Power BI Core Concepts

You can learn Microsoft Excel (and some other tools) as a bunch of Tips & Tricks…
With Power BI, if you do not master the “Core Concepts” you might find yourself struggling forever (or building house-of-cards!).
The Usual Way of Learning
I started off as an Excel user. And really, Excel is something you can learn as a bunch of tips and tricks. I mean, there are tons of books out there titled things like "1001 Tips and Tricks." I owned those books, and I saw them on many desks. You just pick up something new—XLOOKUP, MATCH, INDEX—and everything builds upon your skills. That’s how you become more powerful in Excel.
This isn’t just about Excel though. It’s about the approach of learning anything in bits and pieces. And honestly, it's the approach most people take.
We have these great learning tools now: Google, YouTube, ChatGPT. They're amazing. I call them the jigsaw puzzle of learning. And here’s the challenge...
Why That Approach Fails with Power BI
Power BI doesn’t quite fit into that model. That’s what I ran into myself—and what I see over and over in people I talk to. Folks say things like, "Avi, I've been using Power BI for years, but I still feel like I’m on thin ice."
Even after years of experience, they don’t feel at home in Power BI. They’re unsure. It doesn’t feel solid. And here's why:
Power BI has a set of core concepts. And until you master those, you’re never going to feel comfortable. You’ll always feel like you’re building a house of cards.
Sure, you can hack things together. But that’s what it feels like—a hack. And sometimes, you might even feel like a hack 🙈. You might be nervous to have someone review your work. Would you be comfortable if I, or another Power BI Pro, looked over your dashboard?
I don’t want you to feel that way. I want you to feel confident. And that comes from building a solid foundation.
The Good News
The good news? Power BI can feel like endless learning, but it doesn’t have to. If you focus on the core concepts, you’ll unlock the 80/20 advantage: the 20% of effort that gives you 80% of the results.
“Focus on the 20% Core Concepts, that will give you 80% of Your Results in Power BI”
Once you have the core concepts down, then tools like Google, YouTube, and ChatGPT truly become your friends 🤝🏻.
Before, you were just trying to patch things together. Now, you can:
Ask smarter questions
Understand if a solution fits your scenario
Adapt solutions when they're almost right
Catch when you’re headed down the wrong path
Instead of just copy-pasting and hoping for the best, you’ll understand what needs to change and why. That’s a game-changer.
Build Your Foundation
So yes, you’ve got to work on mastering the core concepts. But once you do, you’ll stop feeling like an impostor. You’ll stop fearing a review. You’ll own your work. You’ll feel like a true Power BI Pro.
That’s Step 1. Start here. Build that solid ground—and everything else becomes so much easier.
Resources for Step 1: Want a clear path to mastering Power BI? Our Learn Power BI Program gives you a structured foundation, covering the core concepts and helping you avoid the “jigsaw puzzle” approach to learning.
Step 2: Build a Dashboard (Do Good Work)

“Begin with the end in mind” - Stephen Covey.
Your goal should be to start building impactful Power BI Dashboards as fast as you can 💨. But only if you overcome these challenges…
The Goal: Create Impactful Dashboards
You've probably seen our Wall of Inspiration, filled with powerful dashboards 📊 created by our members from across the world 🌍, in all different industries 🏭.
That is your goal: to create real, functional, impactful Power BI dashboards.
Don't get stuck in "learning mode". I see this all the time. People keep telling me, "Oh, I need to learn more DAX," or "I'm not ready yet." But here's the truth: the sooner you start building, the faster you'll grow. Many dashboards on our Wall of Inspiration were built in under 30 days. You can do that too.
Principle #1: Embrace the Agile Approach
Right Way to Deploy Power BI
Let’s talk about how BI used to be deployed — the old school waterfall approach 🌊. Fancy consultants would come in, dressed in suits and ties, and pitch a BI solution with slick PowerPoint presentations. They’d promise that this thing would solve all your problems. It might cost a million dollars—or if you're a larger company, $100 million or more —and it’d take six months to deliver.
In reality? It would take a year and a half, and at the end of it all... it didn’t even work! It didn’t meet the needs of the business users. In the end, everybody would just export the data to Excel anyway. All that time, money, and effort—wasted.
Now, if you use the old approach with new tools, don’t expect different results. New tools require a new approach. That’s why Power BI is Agile BI.
When I'm working with a client, we work in weekly sprints and deliver our first project in just 30 days! Agile is how you deploy Power BI. But here’s the kicker: that’s also how you should learn Power BI.
Right Way to Learn Power BI
The agile principle applies to learning just as much as it does to implementation. You should be in a constant loop: Learn ➔ Apply ➔ Learn ➔ Apply (and repeat!).
And this is woven into our LearnPowerBI program. Whether you're in our program or not, I highly encourage you to adopt this agile learning mindset. Don’t stay stuck in learning mode.
I talk to a lot of people on the Power BI journey and when I ask, “Have you delivered a project?”. I often hear:
“I’m still learning. Just give me another month.”
Nope. The quicker you can iterate, the faster your growth is going to be. That’s what agile is all about: quick iterations. So again: Learn → Apply → Learn → Apply. Do that and you’ll grow really, really fast.
Or I will hear:
“Yeah, I’ve been doing some test projects.”
Guess what, test projects don’t count! Yes, you would always start there. But you need to start delivering real world Power BI Projects as soon as you can.
Principle #2: The Missing IKEA Manual 🤔
Imagine going to IKEA, buying some flat-packed furniture—maybe a bed—and when you get home, you realize the instruction manual is missing. You’ve got all these parts, but no instructions showing you how to put it all together. Frustrating, right? You’d probably struggle and maybe even fail to assemble it.
That’s what happens to many Power BI learners. And it’s not your fault.
A lot of programs teach you bits and pieces. DAX functions. Power Query buttons. All the technical stuff. But nobody teaches you how to actually put it together.
How do you execute a Power BI project? That’s what’s missing.
It starts with — Selecting the right project! And many beginners shoot themselves in the foot, by selecting the wrong Power BI project! (Essentially setting themselves up for failure, rather than success). Then comes scoping the project, working with stakeholders, managing their expectations, handling scope creep... and finally executing and delivering the project in an agile manner.
We cover all of this inside our course. But whether you learn it from us or elsewhere, you need to know how to execute a Power BI project, not just how to write DAX.
Resource: Ready to build your first or next dashboard? Join our 30-Day Dashboard Challenge where we walk you through the process week-by-week—your IKEA manual for building real-world Power BI projects (for LearnPowerBI Members only).
Principle #3: Getting Stuck Is Part of the Process
❌ The Bad News
Here comes the bad news — Remember the agile cycle I talked about earlier? Well, I left out a few steps.
Anyone who’s tried to learn Power BI and then apply it to their own data knows what I’m talking about. You watch a video, you feel confident, you go to do the same thing with your data—and it doesn’t work 🤬😤.
Not every time, but a lot of times, you're going to get stuck.
This is when people go down the rabbit hole: Google, YouTube, and now, ChatGPT.
⚠️ Warning: Be careful with ChatGPT —beginners often don’t know whether it’s leading them in the right direction or just making things overly complicated. Make sure you have mastered Step #1 Power BI Core Concepts.
Google and YouTube can also be tricky. You type in your problem and get lots of answers—just not the one you need. You read article after article, watch video after video. Some of them come so close, but they still don’t solve your problem.
It’s not your fault.
Businesses are unique. So are their data and their problems. Yes, other people may have faced similar issues, but yours is always going to be just a little bit different. And that’s where you get stuck.
So that’s the bad news: getting stuck is inevitable.
✔️ The Good News
But here’s the good news: this is where the real learning happens.
The full learning cycle looks like this:
Learn ➔ Apply ➔ Get Stuck ➔ Get Unstuck = Power BI Growth 🌱
Getting stuck is actually a really good sign. It means you’re doing the work that matters. You’re applying what you’ve learned. You’re pushing your boundaries.
But you need to be able to get unstuck. Otherwise, you’re just spinning your wheels, wasting your time and energy.
That’s why inside our program we provide multiple ways to help: email support, our LinkedIn community, and Live Q&A calls. These are lifelines to get you unstuck and moving forward.
Whether you join our program or find help elsewhere, make sure you’re not doing this alone and have a support system.
Final Thought: Build, Build, Build
If I could leave you with one piece of advice for Step 2, it’s this: try to build dashboards as fast as you can. Nothing will grow your skills faster than real-world application.
Resources: Need help while working on your dashboard? Tap into our support system through Live Q&A Calls, our online community, and email assistance — for our LearnPowerBI Members — all designed to help you keep moving forward.
Step 3: Share on LinkedIn (Tell Your Story)

In this day and age, you can’t just do good work and hope to succeed…
You must do good work…and tell great stories (about the work you’ve done)!
Tell a Story: Why Your Story Matters?
If a tree 🌲 falls in the forest and no one is around to hear it, does it make a sound?
If you do good work, maybe even great work with Power BI 📊, but nobody, or very few know about it—does it matter?
We all know the answer. And this is not just theory for me—this was my personal experience. I was so focused on my work, that I never considered what matters for career growth. And now I’ve seen thousands of students go through our Power BI training programs and I’ve seen this one factor play a crucial role in their career success.
“Do Good Work…Tell Great Stories (about your work)!”
🔑 Key to Your Career Success
The math is simple: The more people know your story, the closer you get to Step #5 — Creating a Life of Freedom where jobs and opportunities come to you (Instead of you having to chase them down).
I often joke, that all I teach are the mistakes I made, while learning Power BI and in my Career.
And in my career, the number of people who really knew about the “Stories” of work I was doing, often hovered between one and zero!
One, when my manager cared and had a good idea of all the hard work I was doing.
Zero, when
A) My manager just did not care
B) A Reorg happened, and I got moved to a different manager
C) Or my manager Chose to Move on
All A/B/C happened at a shockingly high frequency throughout my corporate career spanning 15+ years in companies like Lucent, AOL/Time Warner, Washington Mutual and even Microsoft.
I had always been “academically” good and a hard worker. But didn’t really find success, until I accidentally cracked the code and started sharing stories about my work with others (I’ll save that story for another day 😉).
But please, learn from my mistakes.
Don’t take the passive approach of “I let my work speak for itself.”
You deserve better than that, your goals and dreams deserve better than that, your loved ones deserve better than that. You need to actively take charge of your own career and destiny. And you can start that by sharing stories of all the good work you have been doing with Power BI 📊.
Ah…and I am already hearing the “Yeah, but…” from you 😊…
Tell Your Story: Objections (Your “Yeah, but…”)
Whenever I speak to people about “Sharing their Story”, I often either hear:
"But It feels like bragging."
"But I'm not an expert."
“But I’m an Introvert.”
“But it Feels Like Bragging…”
I get it—nobody wants to come off as arrogant. To me, bragging is that “Look at me, I’m so awesome” energy. And honestly? That can be a turnoff.
But here’s what I’ve noticed about the people I truly admire: they don’t just post their wins. They share their journey—the real, raw, sometimes messy path they're walking. That’s what makes it powerful.
It’s easy for someone at the top to talk about how great they are. But what takes real courage—and what feels way more authentic—is sharing the in-between. The figuring-it-out. The learning and stumbling. The highs and the lows.
And let me be real with you: when I look at the top experts, I often feel overwhelmed. Sometimes I even feel like a fool. There’s this little voice that says, “I’ll never get there… I’ll never be as good.”
So personally, I find it way more helpful to follow people who are still on the path. Folks who are just a few steps ahead of me. They remember what it was like to be where I am. They explain things in a way that makes sense because they just figured it out themselves. And when they share, I often walk away thinking, “Hey, I can do that too.”
That’s why I say: share your journey. Do it authentically. Because that’s not bragging—it’s generosity. It’s how you lift others up who are a few steps behind you. And trust me, there are always people a few steps behind you.
“Share Your Journey (the highs and lows)! That’s more authentic and helpful for others, than only sharing your accomplishment when you’ve reached the top.”
“But I’m Not an Expert”
Here’s the truth: very few people can legitimately claim the title of “expert.” I certainly don’t feel like one. In fact, I often feel far from it. There are so many people out there who are way more skilled in Power BI than I am—and that’s okay.
Because here’s the good news: you don’t need to be an expert. And you definitely don’t need to pretend to be one. What you can be—and what’s just as powerful—is a Power BI enthusiast.
For me, I’ve always been enthusiastic about using Power BI to solve real business problems. That’s where I light up. I love helping others do the same—especially business users. Not the techies, but the folks on the frontlines of the business. Because I was that person. I know how frustrating it is when you don’t have the skills or support from IT, and yet you're the one who most needs that data insight and intelligence.
So when I share, I’m not sharing as an expert. I’m sharing as someone who’s passionate about this tool and what it can do. That’s it.
And that’s enough.
So ask yourself: What are you enthusiastic about when it comes to Power BI? Maybe it’s data storytelling. Maybe it’s helping your team automate reporting. Maybe it’s just that rush when the DAX formula finally works! Whatever it is—lean into that. That’s what people connect with. That’s what makes your story worth sharing.
“You don’t have to be a Power BI Expert, Be a Power BI Enthusiast”
(and share your enthusiasm with others by sharing the stories about your Power BI work!).
“But I’m an Introvert…”
I hear this one a lot: “But Avi, I’m an introvert.”
And my first response is—Yeah, same here. People don’t always believe me. They say, “No way, Avi. You’re all over YouTube, you do live streams, you speak on stage…” But here’s the thing: most of what people associate with being an extrovert—like public speaking or posting on social media—has very little to do with being introverted or extroverted.
Because those are learned skills. No matter who you are—introvert or extrovert—you’re going to stumble when you start. You’re going to feel awkward. But that doesn’t mean you can’t learn. That doesn’t mean you can’t grow. That doesn’t mean you can’t get really good at it over time.
Now, I’m not saying introverts and extroverts are the same. Not at all. There is a difference—and that difference shows in your approach. But that’s actually the beauty of it: you get to do it your own way.
And both ways can work.
Just look at Tony Robbins and Steve Jobs. Tony Robbins—massive energy, huge stage presence, classic extrovert. Steve Jobs—quiet, private, soft-spoken, classic introvert. Are they both powerful speakers? No doubt. But they did it completely differently.
So don’t buy into the myth that you have to be loud to be impactful, or outgoing to be visible. You just need to show up—in your way.
At the end of the day, it’s not about being an introvert or extrovert. It’s about knowing that these are skills you can build. And if they can learn it, you can too.
“Introvert or extrovert doesn’t matter—what matters is that you show up as you.”
Tell Your Story: Why LinkedIn?
Actually, you don’t have to use LinkedIn at all. If you fit the profile of “Raj” below…
Best and Worst Way to Find a Job (or Client)
According to the #1 job-hunting guidebook, What Color Is Your Parachute?, the worst way to find a job is through Resumes. And the best way? Networking.
And we’ve all felt that. Sending out dozens (or hundreds) of resumes often feels like shouting into the void. But real conversations, real connections — networking is where the magic happens✨.
Meet Raj (Who has never used LinkedIn)
Now let me tell you about a friend of mine—let’s call him Raj. He lives here in the Seattle area. We used to work together at Microsoft. Since then, Raj has bounced around to a few local giants—Amazon, Costco, Starbucks (all companies headquartered here in Seattle).
And Raj has never used LinkedIn. He meets people over coffee. He has lunch with colleagues and friends. That’s how he networks, and that has led to all of his new jobs.
So if you’re like Raj — you aspire to work with companies in your local area — by all means, skip LinkedIn.
But my life looks a little different.
I can work from anywhere in the world. Sometimes I’m traveling with my family. Sometimes I’m visiting my parents in India. And you know what? My work doesn’t skip a beat.
And my clients are from all over the world. I don’t need to think about where I am or where they are. I can be anywhere, and they can be anywhere. And that works beautifully (with ample use of www.WorldTimeBuddy.com, my favorite site to find a time that would work for me and my client, no matter our timezones).
If You Want a Different Life (Now or Later)
If the kind of life I described above (work from anywhere), is the kind of life you want (now, in the future)— then consider getting started on LinkedIn.
Because if Networking is the best way to find opportunities (jobs and clients):
Where are you going to network when your world is no longer local?
Coffee meetings won’t cut it. Conferences are expensive and infrequent.
But LinkedIn? It’s always there. It’s global. And it’s powerful.
Sure, social networks have their flaws. But LinkedIn is still the best professional networking tool we’ve got.
And as I often say: put your goals first. Put yourself first. If using LinkedIn can help you move closer to the life you want—isn’t that reason enough to start?
“If Networking is the Best Way to Find New Jobs and Clients - Where are you going to network if you want to work from anywhere in the world?
Get Started on LinkedIn Today!”
Final Take: Don’t Let Your Objections be Bigger Than Your Goals
You may still not be convinced. Or you may have a list of other objections.
But I want you to remember what is the most important reason: your goals. We’ll talk more about this in Step 5 (which is all about creating a life of freedom). And “Life of Freedom” can mean different things to different people. I don’t know your personal definition of that life, but I know it’s important to you. If telling your story on LinkedIn helps get you closer to your goals, isn’t that reason enough?
Focus on your goals. Because your goals are worth it.
Resources for Step 3 (Tell Your Story): The final module of the Dashboard Challenge teaches you exactly how to tell your story. And if you need inspiration, check out our Wall of Inspiration to see real stories from students just like you.
Step 4: Leverage to Get Job/Promotion/Client

“Your next job is likely to come from your next conversation.”
(If you did not skip Step 3 and have a good story to share in that conversation 😉)
This is where things start to shift. If you’ve done the first three steps—learned the basics, built something, and shared your journey—people will notice. And when they do, opportunities show up.
I’ve seen it so many times. Someone who’s been quietly doing good work for years suddenly gets visible—and within weeks, they’re getting messages, interviews, referrals, even job offers or client inquiries.
When people see your work and your story, they start to trust you. That’s what gives you leverage. You don’t have to beg for jobs. You don’t have to send out a hundred resumes. Your story is your resume. Your LinkedIn profile becomes a portfolio. Your posts become proof. You’re no longer just another applicant. You’re a known quantity.
And it’s not just about job hunting. Even inside your company, visibility matters. Want that promotion? That raise? That new project? You need to be top of mind. And nothing makes that happen faster than showing your work and owning your story.
Resources: Once you complete Steps 1, 2, and 3, we offer advanced training inside our Learn Power BI program. We teach you a powerful method of using networking and informational meetings—not resumes—to land jobs. Because the best way to get a job today? Stop asking for one.
Step 5: Create Life of Freedom (The Flywheel)
There are many ways to define freedom.
One of my favorite is “When jobs and clients come to you!” (rather than you having to chase after them).
This is what it’s all about. This is why you started. It’s not just about dashboards or DAX. It’s about building a career—and a life—you actually want.
For me, that means flexibility. Freedom. Time with my family. The ability to say “yes” to the projects I care about—and “no” to the ones I don’t. The ability to travel. To take breaks. To breathe. And it all started with the steps I just shared.
And here’s the cool part: this isn’t some big leap. It’s a cycle—a flywheel. Each step builds on the last:
Learn the basics
Build something real
Share your journey
Let the opportunities come to you
Use that to create freedom
Then repeat.
Every time you go through the cycle again, it gets easier and more powerful. It builds momentum. It builds confidence. And over time, you’re not just learning a tool—you’re transforming your career. Your story. Your life.
Resources: To go even deeper, we offer training in our Career Coaching Program. This is where we teach the full Flywheel System and the Hare and Tortoise strategy—our signature system for creating a life of freedom. It’s not easy to get started, but once it spins, it keeps spinning, bringing you a steady stream of opportunities.

Conclusion: Take the Next Step
You don’t have to have it all figured out. Just take the next step.
Maybe that’s committing to really learn the basics. Maybe it’s finally building a dashboard. Maybe it’s posting something on LinkedIn. Maybe it’s reaching out to someone you admire in the space.
Whatever it is—do it.
One step at a time.
Don’t just learn Power BI. Use it to change your life.
You’ve got this.
Let’s go.
🔗 Link to current article: www.LearnPowerBI.com/5steps
🔒 Link for Team Avi: Support Resources for 5-Steps

Scaling Power BI Analytics 📊 for Sales, Marketing, Supply Chain
Are you ready to be inspired by a real-world Power BI success story? In this recording of our LinkedIn Live session, Manuel Fuentes, Director of Marketing, Pricing & Business Analytics at Labelmaster, shared his incredible journey of implementing and scaling Power BI within his organization.
Manuel was one of the earliest members of the LearnPowerBI program, joining back in 2018. Since then, he’s transformed Labelmaster’s approach to data and analytics, creating a powerhouse team that drives impactful decisions across sales, marketing, supply chain, and more.
During this session, Manuel delved into:
✔️ The challenges and milestones of rolling out Power BI across departments.
✔️ How his team has used analytics to increase margins and operational efficiency.
✔️ Exciting innovations in data, BI, and AI at Labelmaster.
And there’s more! Manuel also revealed an exciting opportunity to join his team. If you’re passionate about data and analytics, this could be your chance to take your career to the next level!
🎥 Don’t just take our word for it—watch the full session to hear Manuel’s story firsthand and discover what’s possible with Power BI.
➔ Connect or Follow Manuel Fuentes on LinkedIn
➔ Connect or Follow Nidhi Johnson on LinkedIn
➔ Apply for Open Position at Labelmaster: Marketing Data Analytics Manager
👉 Ready to master Power BI and create impact like Manuel? Join the LearnPowerBI program and start your journey today. Click here to learn more and apply.

Driving Growth for Dental Clinics 🦷 with Power BI 📊
Click Play above 👆 to watch video
Interview with:
Dr. Daniel Klauer / Owner / TMJ & Sleep Therapy Center Indiana
❝Without a doubt, I'd have zero hesitation to recommending Avi. You'll get immense value, and you'll genuinely enjoy working with him❞
Working with data can be a love-hate experience.
There's so much valuable insight you can gather, but for us, it used to be quite challenging. We were stuck in Excel, constantly sorting pivot tables, and dealing with errors that would cause everything to fall apart. It was a real pain point.
But working with Avi has been like hiring a perpetual employee who takes care of all our reporting needs without the hassle of managing another person.
Now, I can simply log in on my phone—the app is awesome, better than I expected. I even showed it to a friend who's an orthodontist, and it's just so cool to be able to look at and share data on a moment's notice.
If you're looking to implement Power BI, I would undoubtedly recommend Avi.
It's not just about making charts; it's about understanding the business.
The other two companies I spoke with didn't understand what we do or why. They were just going to take the data, make a table, and be done. Avi goes deeper. He added elements to our Power BI system that we hadn't even thought of but now realize we needed.
Without a doubt, I'd have zero hesitation to recommending Avi. You'll get immense value, and you'll genuinely enjoy working with him.❞
Full Interview with Dr. Daniel Klauer
Note: This article is adapted from the original video interview. While it captures the main points and insights, some wording has been modified for clarity and brevity.
Can You Tell Us About Yourself and TMJ Sleep Indiana?
“I am Dr. Daniel Klauer, a dentist who dedicates 100% of my time to treating patients with headaches, migraines, snoring, and sleep apnea. At TMJ Sleep Indiana, my team and I help both adults and children overcome chronic pain and sleep issues, aiming to improve their quality of life.
I've been practicing for over 12 years, and I take pride in the transformative nature of the work we do, from helping couples sleep better together to giving young professionals a chance to reclaim their careers by addressing their sleep and pain problems.”
What Does Growth Mean to You Beyond Just Sales? 🌱
“Growth for me isn’t just about numbers. It's a threefold concept: personal, professional, and patient-related. On a personal level, growth is about setting an example for my family, being a good husband and father, and teaching my children the value of ethical, honest work.
Professionally, I want to create a positive culture within my clinic—a place where my team members feel respected, valued, and passionate about their work. Growth means seeing my team thrive both personally and professionally, even if it means some members outgrow the clinic and move on to greater opportunities.
From a business perspective, growth means finding and serving the right patients—those who can benefit most from what we offer at TMJ Sleep Indiana. It’s important to me to get the right people in front of the right practitioners, and to be honest with patients about whether my clinic is the right fit for them.”
What Challenges 🛑 Did You Face with Data and Reporting?
“Like many medical professionals, I have a love-hate relationship with data. I acknowledge the immense potential that data holds but point out the challenges in managing it efficiently, especially for more specialized practices like mine. Unlike general dental practices, which often have streamlined analytics tools, TMJ Sleep Indiana operates in a gray area between dental and medical practices, using a mix of dental software, medical records systems, and tools like HubSpot for marketing.
Previously, the clinic relied on Excel spreadsheets to compile and analyze data, which often led to frustrating errors and inefficiencies. A small mistake could disrupt the entire reporting system, making it difficult to get accurate, up-to-date insights into the business. This was one of the major pain points that I sought to address by improving our data analytics capabilities.”
Why Did You Choose to Work with Avi Singh for Power BI Consulting? 🤝🏼
“Working with Avi Singh felt genuine from the start. Avi's curiosity and interest in understanding the needs of TMJ Sleep Indiana were evident early on. I appreciated Avi's candid approach and willingness to honestly assess whether he could add value to our operations.
This honesty and attention to detail were what set Avi apart from other consulting firms. The other firms I consulted with were primarily focused on generating reports without taking the time to understand the nuances of my business. Avi, on the other hand, worked to integrate himself into the business, asking insightful questions and even offering suggestions that we hadn’t initially considered.”
How Has Data Reporting Changed Your Business? 💡
“One of the standout benefits that Avi's Power BI solutions provided was clarity—particularly in times of doubt. I recall a recent instance where the team perceived that our patient intake numbers were down. Thanks to the new reporting, we were able to see that while some cases were delayed due to patient readiness, the overall patient flow was actually on track.
This ability to distinguish perception from reality has been invaluable. The reporting tools have given us an objective outlook, helping us track patient progress and make informed decisions about where to allocate our energy and resources. I also feel that we are just scratching the surface with the capabilities of the Power BI solution, and even the first version of the product exceeded my expectations.”
How Has Improved Data Reporting 📊 Impacted Your Team Meetings and Workflow?
“The improved data reporting has had a significant impact on how our team operates. For instance, Jillian, a team member, now starts meetings by sharing key data points—for instance, which referral sources have increased or decreased. This kind of insight has allowed us to invest time and resources in the right places and even take action, such as visiting specific areas to thank referring offices.
I described the integration of Power BI as akin to hiring a perpetual employee who manages data without adding extra strain on the team. My team feels empowered with better data insights, and I enjoy the convenience of being able to pull up business analytics from my phone and share insights on the go.”
Did You Have Any Hesitations 🤔 About Adopting New Technology?
“Reflecting on the initial decision to invest in data analytics, I trusted the advice of a business confidant, who pointed out the inefficiencies in our existing system and recommended automating data processes. This trust enabled me to move quickly and confidently in adopting a new platform. Working with Avi further reinforced this trust, as Avi’s approach mirrored my own philosophy: building genuine relationships before diving into the details.
I emphasized the importance of collaboration—not just outsourcing work. Getting the most value from Avi's consulting required active participation, sharing feedback, and working as a partner rather than just handing over tasks.”
Would You Recommend Avi Singh for Power BI Consulting? 👍
“I would wholeheartedly recommend Avi Singh's services. The value, professionalism, and care that Avi brought to the project were exceptional. The true power of the consulting engagement went beyond just building dashboards. Avi took the time to understand the business and provided features that we hadn’t even realized we needed. I emphasized that Avi's approach was about creating the right solutions for the right clients—not just taking every project that came along.
The personal touch, ease of communication, and commitment to efficiency were also highlights for my team and me. Jillian, in particular, found the collaboration enjoyable, and we both appreciated Avi's proactive follow-up and effective reporting practices.”
What Are Your Final Thoughts on Investing in Business Analytics? 🌟
“I concluded by reiterating the importance of investing in your business and choosing trusted advisors. I believe in being the kind of client you would want in your own practice—someone open, collaborative, and willing to trust the expertise of the professionals you work with. Working with Avi Singh and adopting Power BI has not only transformed our data reporting but also helped strengthen the culture of continuous growth and improvement at TMJ Sleep Indiana.”
Scroll up 👆 to watch the Full Video Interview ▶️ with Dr. Daniel Klauer
Click below 👇 to get Power BI Consulting help for your business.

“Grow Your Practice, Using the Power of Your Own Data”
Power BI Report Screenshots
The screenshots below are for demonstration purposes only and use anonymized sample data.
Every report we build is custom-tailored to your clinic’s unique needs and growth goals.
The key idea is simple: you already have the data, and when you can see it clearly with Power BI, you gain the insights to focus on patient care, guide practice growth, and bring your whole team together around what’s working, what needs attention, and where to act with confidence.
Menu – Practice Growth Funnel
Showcase the entire patient journey — from attracting leads, to converting them into patients, to serving and retaining them — for clear visibility into practice growth.

Finance – High Level View
Track production, collections, and key financial metrics to understand clinic performance and spot growth opportunities.

Finance – Annual Trends
Compare multi-year performance to identify long-term trends and ensure the practice is consistently growing year over year.

Inbound Source
See where new patients are coming from — dental referrals, medical referrals, online, advertising, or other sources — and optimize your marketing mix and fuel your practice growth.

Call Tracker (Front Desk)
Measure how effectively your front desk turns calls into scheduled appointments, ensuring fewer missed opportunities.
Conversion
Track how many new patient exams turn into accepted treatment plans, revealing strengths and gaps in patient conversion.

Treatment Tracker
Understand what treatments are being provided, their financial impact, and how services contribute to overall practice growth.
Inbound Referrals Detail
Drill into referral details to recognize top referral sources, strengthen relationships, and spot changes that need follow-up.

Outbound Referrals
Track outbound referrals to dental and medical partners, reinforcing trust and building stronger two-way referral networks.

Demographics
Understand your patient base by age and gender to tailor services, marketing, and engagement strategies effectively.

Demographics (Location)
Map where patients are coming from, identify hotspots, and guide marketing, networking, and referral outreach efforts.

And there’s more…
Additional dashboards we’ve built to give you even deeper insights into patient retention, payments, and practice growth.
Website Analytics
Track online traffic trends from Google Analytics to understand how potential patients are finding your practice.Social Media Engagement
Monitor the impact of your social presence and identify which channels drive meaningful patient interest.Advertising Performance
Measure ROI on paid campaigns to ensure every marketing dollar contributes to patient growth.Outreach CRM (HubSpot/Similar)
Track provider outreach and relationship-building efforts to strengthen referral networks.Event Tracking
Measure attendance and engagement from hosted events to evaluate their effectiveness in attracting new patients.Treatment Progress & Compliance
Stay on top of patient follow-through and ensure treatments are delivered smoothly and effectively.Appointment Efficiency
Assess how well the team manages start times, end times, and overall scheduling to maximize productivity.Recare Trends
Drive retention by tracking annual recare visits and ensuring patients return for ongoing care.Patient Lifetime Value
Understand the long-term value of each patient, including extended or multiple treatments.Google Reviews
Monitor and grow your online reputation to attract new patients through trust and credibility.Patient Referrals
Track referral activity separately to strengthen word-of-mouth growth strategies.
Send me a message using form below 👇 or just email me at avi@avising.com

How Power BI 📊 Transformed Sales Tracking for Law Firm ⚖️
Click Play above 👆 to watch video
Interview with:
Moshe Amsel / CEO / Profit with Law
Note: This article is adapted from the original video interview. While it captures the main points and insights, some wording has been modified for clarity and brevity.
Why the Sales Engine is Vital for Law Firms' Growth ⚖️
“For any business, the name of the game is bringing in clients. We always look at that revenue number as the barometer of how we’re doing. That’s really what keeps the engine running—getting clients in the door.”
The Challenges 🚧 Law Firms Face in Motivating Sales Teams
“Law Firms are unique in that they can’t pay commissions to salespeople the way other industries can. This means they often have confusing bonus structures that make it hard for salespeople to know what they need to do to succeed.
In one particular case, the firm had a team-level bonus system where it didn’t matter if one person made $5 and another made $1—they both got the same payout. This motivated the team as a whole but failed to motivate individuals.”
Tracking Sales Progress Before Power BI 📝
“Before we worked together, the firm relied on spreadsheets to track sales, and much of the process was manual. While some steps were automated, they still had to manually update the details of each sale. At the end of each month, bonuses were calculated using these spreadsheets, making the entire process cumbersome and time-consuming.”
The Problems with Manual Tracking ⚠️
“First of all, everyone on the sales team had access to the sheet, which always left room for human or even malicious error.
There was also no easy visual way to see how an individual salesperson was doing. Each salesperson had to filter through the entire sheet to find their numbers, which was cumbersome.
The old structure wasn’t individualistic, so they only cared whether the team hit a fixed number—once they did, everyone got the same bonus. This actually became demotivating over time.”
🤔 Do I Really Need Power BI? Why Existing Tools Aren't Enough
“As a Fractional CFO, I use various tools for reporting on financials, but they fall short when things get complicated, like with convoluted sales bonuses or marketing analysis. We needed a more customized solution—one that went beyond what out-of-the-box tools like QuickBooks could provide.
The challenge was how to create a visual tool that could help the firm make better business decisions while being efficient and cost-effective.”
Power BI Brings Clarity 💡 and Motivation to Sales Performance 🚀
“You and your team used Power BI to create an incredible tool. We now have real-time, up-to-date information available to the sales team. Just today, I was in a meeting where we used the tool to analyze sales performance.
One salesperson is only $20,000 away from unlocking the highest bonus—she’s motivated because she can see exactly how she’s doing.
Another salesperson, meanwhile, hasn’t even hit the minimum threshold yet. This visibility has been a game-changer; it motivates the right behaviors and will help save money on bonuses that were previously being paid to people who didn’t deserve them.”
From Hours ⏳ to Minutes: Automating Bonus Calculations
“The dashboard has automated the bonus calculation process. What used to take three to four hours each month now takes just five minutes. All the data is live, and after the last day of the month, everything is calculated automatically. It’s a huge time saver and has taken away a dreaded monthly task.”
The Agile Approach 🔄 to Building the Dashboard
“The way we worked together was ideal for me. I prefer to think on my feet, make changes on the fly, and get something into our hands to test.
Spending weeks at a drawing board isn’t my style. When I reached out to you, we had a tight deadline—11 days to get a dashboard in place. We had a working version by then, and a final version a few weeks later. The agile approach made that possible.”
Future Possibilities with Power BI 📊
“One area I’d love to explore is automating the separation of personal and business expenses. Currently, we have to do this manually, but if we could build a Power BI dashboard that identifies these categories automatically, it would simplify our process immensely.
Another idea is to better track marketing campaigns, especially linking spend to revenue generated over different time periods—something that out-of-the-box tools just can’t do effectively.”
Do You Recommend Power BI Consulting with Avi? 🤝🏼
“Absolutely! Even before working with you, I knew about your expertise in Power BI through our mutual business mentor. When I faced a tight deadline, I immediately thought of you. The work you’ve done has truly exceeded my expectations, and I see a big opportunity for us to keep collaborating. For anyone needing dashboards in Power BI, I highly recommend Avi and his team.”
Scroll up 👆 to watch the Full Video Interview ▶️ with Moshe Amsel.
Click below 👇 to get Power BI Consulting help for your business.
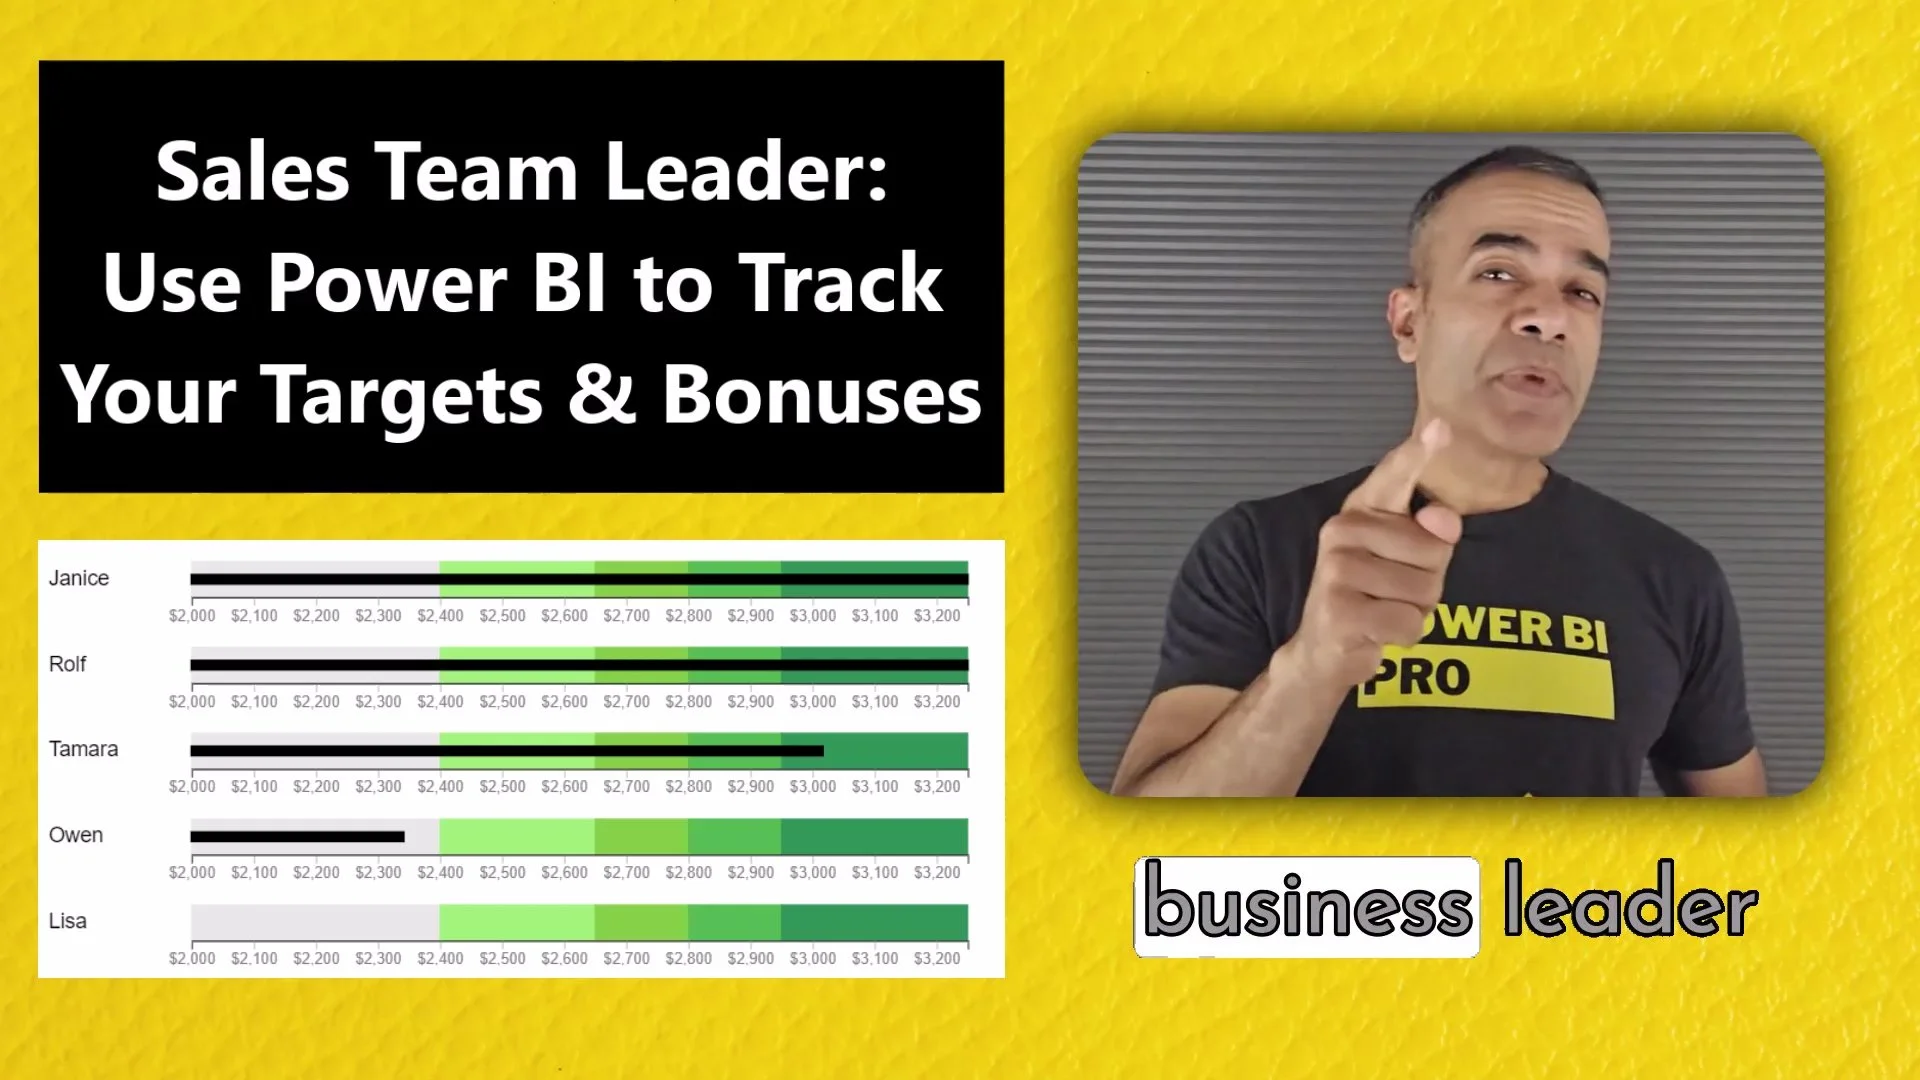
Business Leaders: Track Your Sales Targets 🎯 and Bonus using Microsoft Power BI 📊
Click Play above 👆 to watch video
If you’re a Sales Team Leader, you probably already have targets 🎯 and bonuses 💲 for your team, to keep them motivated. But if your team can’t easily track their progress, it doesn’t work as well as it should.
In this article, I’ll show you how to keep your sales team motivated and pushing toward their goals by using a Microsoft Power BI report that helps them see exactly where they stand against their targets and their path to unlocking their next bonus!
Why Tracking Sales Targets and Bonuses Matters
Salespeople are often driven by clear goals and the promise of bonuses. As a Small Business Owner, you likely have individual and team goals with multiple tiers and bonus levels. However, if you’re still tracking these goals using a jumble of Excel sheets or Google Sheets, it might not be as effective as you’d like.
That’s where Microsoft Power BI comes in. Power BI can provide a beautiful, easy-to-use report that automatically refreshes and always shows your team exactly where they stand. Let’s explore how this can help your business.
Benefits of Using Power BI for Sales Tracking
Here are some key reasons why Power BI can transform the way you track sales targets and bonuses:
Clear and Accessible Reporting: Sales teams can access their reports from any device—laptop, tablet, or mobile—making it easy to check progress wherever they are.
Automated Updates: The reports automatically refresh, showing real-time progress, which keeps your team engaged and focused on hitting their goals.
Motivation Through Visualization: Sales teams can see visually how close they are to the next bonus tier, keeping them motivated to close more deals and shrink that gap.
Power BI Sales Targets Walkthrough
Here’s a quick overview of the features and reports I cover in the video to help you manage your sales targets and bonuses effectively:
Team Goals Overview: At the top of the report, you can see the team goals for the selected month, including different tiers, targets, and bonuses. Management can adjust these goals at any time, whether to push the team higher or respond to market conditions.
Visual Progress Against Goals: A graph shows your team’s progress against their goals, and a table provides detailed numbers. You can see how much revenue has been achieved, what tier has been unlocked, and the total bonus earned so far.
Motivation Through Gap Visualization: The report highlights the gap between the current status and the next bonus tier, which motivates salespeople to close the gap as they complete more sales.
Individual Goals Tracking: For each team member, you can track individual progress against their personal goals, with a visual display showing which tier they’ve achieved and the bonus they’ve unlocked. It’s a powerful way to help each salesperson stay focused on their targets.
Performance Breakdown by Team Member: The report includes a table that shows how each team member is performing. You can identify your top performers, like Janice and Rolf, who have hit the highest bonus tiers, as well as those who may need more support to reach their targets.
Sales Trends and Projections: A trend line helps you track where the team is headed based on current performance, allowing you to forecast whether they’ll meet their targets by the end of the month. This is particularly useful for sales leaders to keep an eye on progress and adjust strategies if needed.
Scroll up 👆 to watch the Full Video ▶️, to see the full Power BI Sales Tracking Report walkthrough in action.
Interactive Power BI Sales Tracking Report
About the Author
I’m Avi Singh, a Power BI Microsoft MVP based in Seattle, WA, and through my consulting services at LearnPowerBI.com, I’ve helped companies of all sizes. Now, my passion is helping small businesses grow their sales by using data analytics.
Need Power BI help? Just Contact Me

Business Leaders: Know Your Customer Demographics 👨👩👦 using Microsoft Power BI 📊
Click Play above 👆 to watch video
As a business leader, you’re already investing 💲💲💲 in marketing and advertising to grow your business. But did you know that 50% of that money is often wasted? The key is figuring out which 50% is ineffective.
This is where Microsoft Power BI comes in. By understanding your customer demographics, you can optimize your marketing spend and focus your efforts on the right locations and audience.
Why Customer Demographics Matter
Knowing your customer demographics is essential for making informed decisions that drive your marketing success. By using Power BI to analyze data such as location, age, gender, and more, you can fine-tune your marketing strategies, by knowing:
Who to Target: Identifying key customer segments, such as age groups or gender, allows you to focus your marketing on the most engaged audiences.
Where to Target: Analyzing customer location helps you prioritize regions with high engagement and profitability, ensuring your advertising reaches the right areas.
How to Target: Understanding the preferences and behaviors of different demographic groups allows you to craft personalized campaigns that resonate with your audience.
By leveraging demographic insights, you can make smarter, data-driven decisions that help reduce wasted spending and maximize the impact of your marketing efforts.
Power BI Customer Demographics Walkthrough
Here’s a quick look at the key reports I demonstrate in the video, showing you how Power BI can provide detailed insights into your customer demographics:
Visualize Customer Locations: Easily map out where your customers are located, giving you a clear view of geographical distribution.
Sales Insights by Location: Dive deeper into customer locations by adding sales metrics like Sales Count, Sales Amount, and Customer Count, represented visually with bubble sizes for quick comparison.
Demographics Breakdown by Location: Go a step further by analyzing your customer locations with additional layers of information, such as gender, products sold, or other key attributes, to tailor your strategies.
Sales Distance Distribution: See how far your customers are willing to travel! Visualize the distribution of your sales by distance—are most of your customers within 5 or 10 miles? Use this data to refine your marketing reach.
High-Value vs. Low-Value Segmentation: Leverage one of the most powerful features in Power BI by segmenting locations and customers into high-value and low-value tiers. This allows you to focus your efforts on your most profitable regions and customers.
In-Depth Customer Attributes Analysis: Analyze your customer base using key demographic attributes like age, gender, occupation, and more. Whether you’re tracking family size, marital status, or any other relevant data for your industry, this report gives you the power to fine-tune your customer insights.
Scroll up 👆 to watch the Full Video ▶️, to see the full Power BI customer demographics walkthrough in action.
Interactive Power BI Customer Demographics Report
Note: Unfortunately as you can see below, embedding this report here is causing an error ❌ in the “Maps” Visuals. This is only a problem when publishing a report publicly. Not an issue when you would be sharing your report privately. I am following up with Microsoft to attempt to investigate this issue
About the Author
I’m Avi Singh, a Power BI Microsoft MVP based in Seattle, WA, and through my consulting services at LearnPowerBI.com, I’ve helped companies of all sizes. Now, my passion is helping small businesses grow their sales by using data analytics.
Need Power BI help? Just Contact Me
![Call for Speakers: Online Power BI Conference [Oct 2024]](https://images.squarespace-cdn.com/content/v1/642a6d0cf3c1736950e19668/1681490176288-QGHMSZKW8A5B1YTPH6A8/Avi_Grand_Gesture_Wide.png)
Call for Speakers: Online Power BI Conference [Oct 2024]
Have you completed a successful Power BI project for a specific Industry/Niche?
Are you willing to share your journey and lessons learned?
And you already know that sharing your story on a stage is a powerful career boost?
Then I would like to invite you to speak at our upcoming Online Power BI Conference.

Power BI Conference for Business Users
[Oct 23-24, 2024]
How This Conference is Different
Most conferences I've been part of are geared towards very technical aspects of Power BI and are aimed at the technical user.
This is conference is unique because it is:
“A Conference for the Business Users,
Created by the Business Users”
We cut out the geek-speak 🤓 and love sharing simple ideas 💡 and explanations ✔️ to help our audience understand how to get results with Power BI 📊.
How Power BI can help you solve your unique business problems in your specific industry?
How should you go about the journey of adopting Power BI within your team/organization?
How can you follow the best practices and avoid common pitfalls on the path of Power BI?
We are Looking for Unique Speakers…
We are looking for unique speakers…for this unique online event.
Do you…

Love Your Work?
Are you someone who loves Power BI? And even more so, love the impact you create by using your Power BI skills?

Live Your Life?
Your life is more than just money or achievement. You make room for the important things in your life - be it taking care of yourself, family time or travel and adventure.

Have A story to Tell?
You have a story to share of transformation using Power BI.
Then we would love 💛 to have you speak at our upcoming online conference to share your Power BI journey and lessons learned. Just click below to fill out the speaker survey 👇
Why You Should Speak?
In this day and age, you can’t just do good work and hope 🤞 to succeed.
You need to:

And our upcoming Online Power BI Conference, is a terrific opportunity take that step towards your success:
What Previous Speakers Have Experienced

Mindy Qi
Calgary, Canada
Presentation: HR Report Automation using Power BI
❝Would Others Even Care about My Work with Power BI?❞
I knew my Power BI work had been valuable for my team. I had helped automate HR Reports using Power BI, and that had improved the work efficiency for our whole team!
But was this something that other people would care about?
Would they find any of this helpful or relevant?
Would they even care?
But the presentation and the feedback from the audience 💛, was basically a testimony that this was valuable! The listeners made me feel that what I did, probably can also make a difference in their work, in their life. And could be significant help to them too.
That was a really amazing feeling and it really boosted my confidence!
I loved sharing my knowledge about something I am passionate about. I have learned a lot from others in my Power BI journey. Speaking myself at this conference gave me an opportunity to pay it forward and help others. I would highly recommend you take this opportunity and apply to speak.
“The presentation and the feedback from the audience, was a testimony that my work was valuable! An amazing feeling!”

Paolo Damiani
Milan, Italy
Presentation: Using Power BI to Skillfully Navigate Company Transformation
❝I do not have deep technical skills in Power BI. Can I still add value to the Conference?❞
I do not consider myself having a high set of technical skills in the implementation of Power BI, hence was not sure of the value I could add to the conference.
When I delivered my message, I realized that there was indeed value in what I did with Power BI.
My work helped a big takeover to be successful. And the audience recognized that value. As Avi says, “It is not about technology (Power BI), it’s about what technology can do for the business”
“It is not about the technology, it’s about what technology can do for the business”

Susan Zwillinger
Pittsburgh, United States
Presentation: 6 Biomimicry Lessons for Marketing & Market Analytics Using Power BI
❝I have spoken with clients and small groups, but the idea of speaking to a larger group made me nervous!❞
Doubts? I had so many doubts when I applied to speak, where do I start?
My first worry was that my dashboard pages and data model would be too simple to be useful to the audience.
Speaking with clients and small groups has been easy for me, but the idea of speaking to a larger group of people made me very nervous. I was worried that my nerves would hinder me from communicating effectively.
I knew I would have some things to learn, and I worried that I wouldn't have time to adequately prepare..
Results! Before the conference, the speaker presentation training and prep sessions provided by Avi, were very helpful. They helped me create and deliver a presentation that really connected with the audience.
During the conference, Avi set the tone of the session and the audience were welcoming and supportive.
Even though my dashboards were simple, the conference community gave me encouragement before, during and after the presentation. It was a pleasure to connect with many of the attendees through LinkedIn after the conference.
Takeaway: After the conference, I realized that I had learned from all the speakers, not just those who did really well with public speaking. Even when things didn't go exactly as planned, the presentations were useful. It turns out that humans don't need perfection to learn from one another. I learned things that will help me serve my clients and build better dashboards.
“It turns out that humans don’t need perfection, to learn from one another.”
Details & FAQ
Speaker Application Deadline: Friday Aug 18, 2023
Conference Dates: Wed Sep 20 & Thu Sep 21, 2023
Q: I am concerned 🤔 about sharing my company’s sensitive data?
You can easily blur sensitive data when sharing your Power BI Dashboards. Just watch the video below.
Q: I am a first time speaker or only have limited speaking experience. Should I still apply?
If you fit our criteria above (Love Your Work / Live Your Life / Have a Story to Tell), then we strongly encourage you to apply to speak.
There would be help available for first time or new speakers, including training and prep sessions.
Q: What kind of content is a good fit for this conference? Can I see a sample presentation?
Most sessions showcase the story of a successful Power BI project.
You can see below a sample presentations from a past conference.
Q: Do you run other Online events?
Visit www.TalkPowerBI.com to get to know about all our upcoming events.
Power BI Data Modeling & Relationships Guide for Beginners
Data Modeling is perhaps the most important, but least understood concepts in Power BI.
But if you don't master Data Modeling and get it right, then everything else in Power BI becomes harder 🥵. But that's not going to be you, if you just watch the video below :-)
Click Play ▶ below 👇 to watch:
Why Data Modeling is Important in Power BI
Power BI is a powerful tool for data analysis and visualization, but at its core, it relies on a well-structured data model. Without a proper data model:
Performance issues arise due to inefficient queries. 🛑
Reports and dashboards may display incorrect or misleading data. 🚨
Complex calculations become difficult to implement and maintain. ❗
A good data model makes your Power BI reports faster, easier to maintain, and more accurate.
Understanding Data Modeling in Power BI
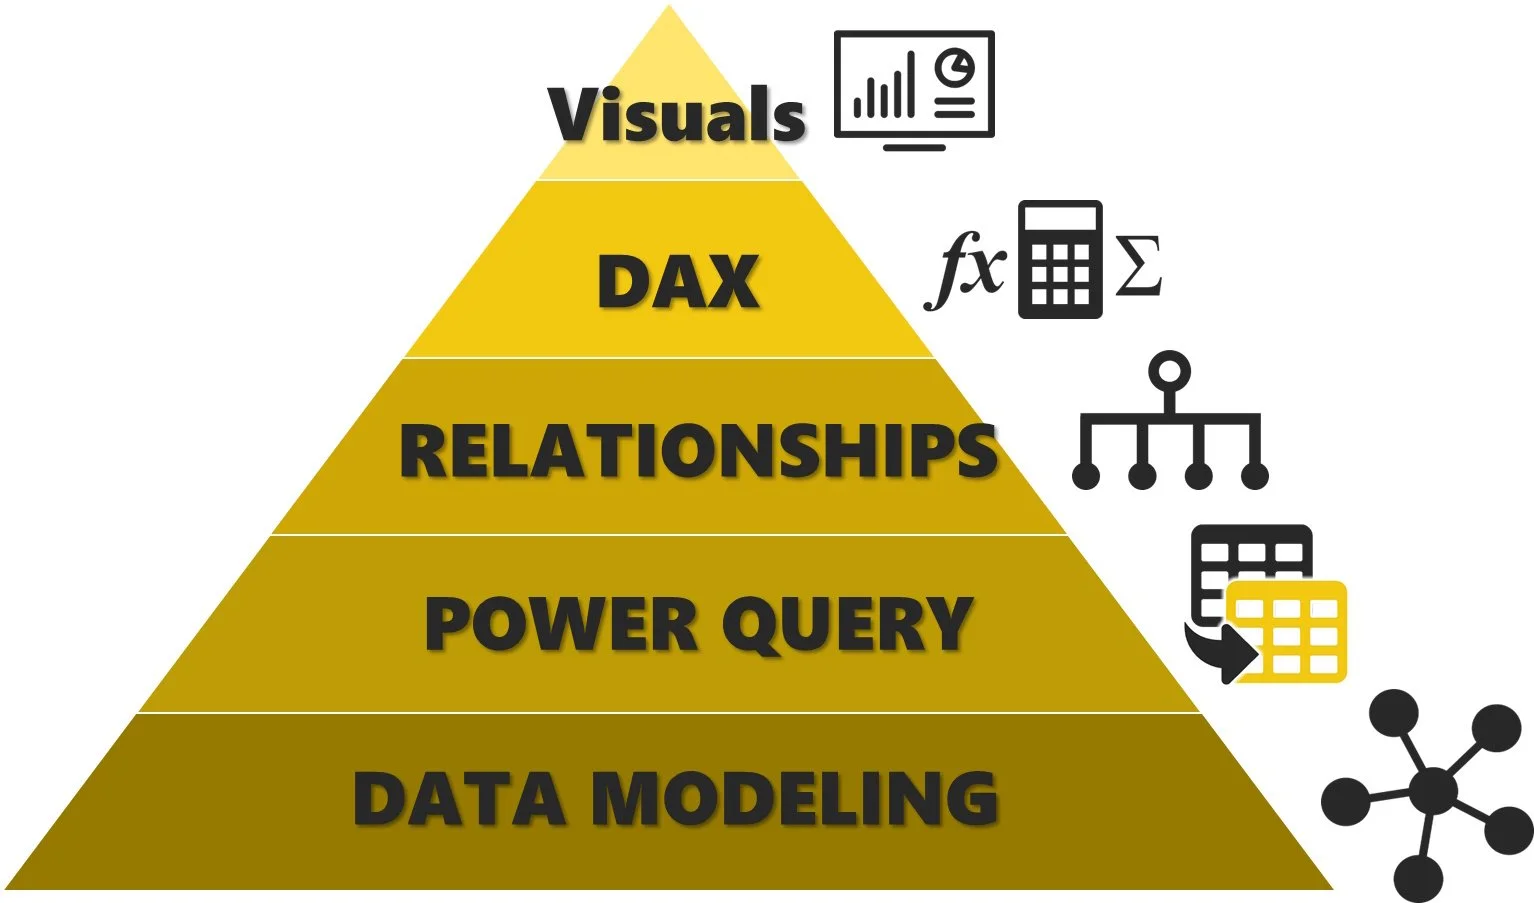
1. Flat Table vs. Star Schema
When designing a Power BI data model, you generally have two options:
Flat Table: Many users, especially ones coming from an Excel background, like to flatten everything to a single table, but that is a very dangerous approach and can lead to serious performance and maintenance issues.
Star Schema (Data Table & Lookup Table): A central Data Table (e.g., sales transactions) with supporting Lookup Tables (e.g., customers, products, dates). This is the recommended structure for Power BI as it optimizes performance and improves data organization.
2. Data Tables & Lookup Tables
Data Tables: Store transactional data (e.g., sales, revenue, expenses). These tables contain numerical values used in calculations.
Lookup Tables: Store descriptive information (e.g., customers, products, dates). These tables help categorize and filter data.
3. Importance of Relationships in Power BI
Relationships define how tables in a data model connect with each other. They ensure that data from different sources can be linked correctly.
One-to-Many Relationship: The most common type. A single record in one table (e.g., customer) relates to multiple records in another table (e.g., sales transactions).
Many-to-Many Relationship: Used when a direct one-to-many relationship is not possible. Recommended to be used with a bridge table.
One-to-One Relationship: Less common but useful for scenarios where data is uniquely mapped between two tables.
How to Create and Manage Relationships in Power BI
1. Using Power BI’s Model View
Navigate to the Model View to visualize table relationships.
Drag and drop fields between tables to create relationships.
Ensure that relationships follow best practices (e.g., avoiding many-to-many relationships when possible).
2. Managing Relationship Cardinality and Cross-Filter Direction
Cardinality: Defines the nature of the relationship (one-to-one, one-to-many, many-to-many).
Cross-Filter Direction: Determines how filters propagate between tables.
Single: Filters flow in one direction (recommended for performance optimization).
Both: Filters flow in both directions (use with caution as it can lead to performance issues).
3. Handling Common Relationship Issues
Inactive Relationships: Sometimes relationships are not automatically used. In such cases, DAX functions like
USERELATIONSHIP()can activate them.Circular References: Occur when relationships create loops. Resolving them requires restructuring the data model.
Ambiguous Relationships: Power BI may struggle to determine which relationship to use. Ensuring proper lookup and data table design prevents these issues.
Best Practices for Data Modeling in Power BI
Use a Lookup Table & Data Table Structure Instead of a Single Flat Table – Improves performance and scalability.
Reduce Unnecessary Columns – Only keep necessary data to improve performance.
Optimize Data Types – Use integers instead of text for IDs, and avoid excessive calculated columns.
Avoid Bi-Directional Relationships – Use single-direction relationships for better performance.
Leverage DAX Measures Instead of Calculated Columns – Measures are more efficient than storing additional data.
Use Date Table for Time Intelligence – Create a dedicated Date table to enable time-based analysis.
Final Thoughts
Mastering data modeling in Power BI is essential for building efficient and scalable reports. By understanding lookup tables, data tables, relationships, and best practices, you can create models that are easier to manage, perform better, and produce accurate insights.
Scroll up 👆 to watch the Full Video ▶️: Power BI Data Modeling Guide for Beginners.
If you want to take your Power BI skills further, consider joining our LearnPowerBI training program, where we take you from beginner to Power BI Pro in just 30 days!

DAX GUIDE: Top 5 DAX Functions to Master Power BI
There are hundreds of DAX Functions in Power BI 😱.
But you don't have to learn them all.
In all my experience working on client projects, I found myself using just these Top 5 DAX Functions most of the time.
And if you give me just a few minutes:
✔️ I will walk you through each one and...
✔️ Show you how to use them
Click Play ▶ below 👇 to watch:
🎁 FREE BONUS: Get My Ultimate Calendar Table 📅 and unlock the full power of DAX Time Intelligence.
Ready to go from a Beginner to Power BI Pro?
Video Covers the following topics:
Top 5 DAX Functions to Master Power BI
#5 SUM, COUNTROWS & A Bonus Function ➕
SUM Function
One of the most basic and widely used functions.
Adds up the values in a column.
Example:
TotalSales = SUM(Sales[Amount])
COUNTROWS Function
Counts the number of rows in a table.
Helpful for determining the number of transactions, products, or customers.
Example:
TotalOrders = COUNTROWS(Sales)
Bonus Function: DISTINCTCOUNT
Counts unique values in a column.
Ideal for counting unique customers or distinct product categories.
Example:
Unique Customers = DISTINCTCOUNT(Sales[CustomerID])
You’ll find yourself reaching for these often when working with aggregations in Power BI.
#4 CALCULATE 🔢
The CALCULATE function is considered the most powerful function in DAX because it allows you to modify the context in which your calculations happen.
Key Features:
Used to apply filters to existing measures.
Modifies filter context dynamically.
Works well with SUM, AVERAGE, COUNT, and other functions.
Example:
Find total sales where the region is "West":
TotalSalesWest = CALCULATE(SUM(Sales[Amount]), Sales[Region] = "West")
#3 X Functions: SUMX, MINX, MAXX etc. 🔄
Next, we dive into the world of X functions, including:
SUMX: Calculates the total revenue by multiplying quantity and price for each row before summing it all up.
MINX: Finds the minimum value row by row.
MAXX: Finds the maximum value row by row.
AVERAGEX: Averages an expression across a table.
The X functions work row by row in a table, applying a calculation to each row and then aggregating the results. They are your toolbox for custom calculations.
Example:
TotalRevenue = SUMX(Sales, Sales[Quantity] * Sales[UnitPrice])
Bonus: Mystery X Function 🔮: FILTER
Here’s a mystery function that deserves special mention:
FILTER: Filter should have been called FILTERX, because it is also an iterator function and operates row by row.
Why Use FILTER?
Allows you to apply complex filtering conditions to tables.
Essential for refining data within calculated columns and measures.
Example:
Filter sales data to include only transactions above 100:
FilteredSales = FILTER(Sales, Sales[Amount] > 100)
#2 ALL Function: Hammer & Chisel Versions ⚒️
The ALL function is like having a hammer and chisel for your data models
Types of ALL Functions:
ALL(Table) – Removes all filters from a table. This is the hammer 🔨 (see video for explanation)
ALL(Column) – Removes filters from a specific column. This is the chisel ⛏️ (see video for explanation).
This function is essential when:
You want to compare a specific value to the overall total.
You need to handle scenarios where filters might distort your calculations.
Example:
Calculate total sales, ignoring any filters on Product Table:
Total Sales AllProducts = CALCULATE(SUM(Sales[Amount]), ALL(Product))
#1 Time Intelligence Functions 📅
Time Intelligence functions are a game-changer in Power BI. These include:
TOTALYTD: Calculates year-to-date totals.
SAMEPERIODLASTYEAR: Compares this year’s performance to last year.
DATESMTD: Calculates month-to-date totals.
They let you perform calculations over specific periods. If your reports involve dates or time, these functions are a must-have in your arsenal.
Example:
YTD_Sales = TOTALYTD(SUM(Sales[Amount]), Sales[Date])
Conclusion
Mastering these five DAX functions will significantly improve your Power BI skills and enable you to create advanced analytical models. Whether it’s basic aggregation with SUM, dynamic filtering with CALCULATE, or time-based calculations, these functions will help you become a Power BI Expert.
Scroll up 👆 to watch the Full Video ▶️: Top 5 DAX Functions to Master Power BI and learn how & when to use each of these DAX functions.
If you want to take your Power BI skills further, consider joining our LearnPowerBI training program, where we take you from beginner to Power BI Pro in just 30 days!

Demystifying the DAX Filter Context in Power BI
As a Non-Techie myself, I was quite afraid of Power BI at the start. Okay, may be "afraid" isn't the right word. It was more like a mix of emotions…
I was excited 😃 , becasue I could see the amazing possibilities with Power BI
I was overwhelmed 😫, because I felt there was so much to learn and I knew so little
I was frustrated 😡, when I got stuck in Power BI even with seemingly simple things
But DAX Filter Context, yeah I was afraid 😱 of that :-)
Too late did I realize that:
❝Without understanding DAX Filter Context …You cannot really master DAX.
And without mastering DAX…You cannot truly master Power BI.❞
But you do not have to make the same mistake :-)
Just click below to watch my bonus training on DAX Filter Context.
Where I take this "complicated" concept and break it down so it's easy to understand.
Interested in Power BI Training or Coaching?
Power BI Feature Request: Larger Icons for Selecting Chart Types

Power BI Visuals are awesome!
I love all the basic ones, they should be the staple of any Power BI Dashboard
Line Chart
Bar/Column Chart
Text Based: Table, Matrix, Card, Multi-Row Card
Then of course, there all these other cool ones 😎: Treemap, Ribbon Chart, Gauge and lots more. (Just be careful you know when and how to use them correctly. Don’t use them just for the coolness factor).
Finally you have lot more options for Custom Visuals, by clicking “Get More Visuals”.

We love Excel, don’t we! yup, we do.
And we love that Excel + Power BI = Great Together! And that is not a co-incidence. Excel and Power BI teams have a long history of collaboration.
And this may be one place, where Power BI can borrow some tried-and-tested goodness from Excel.
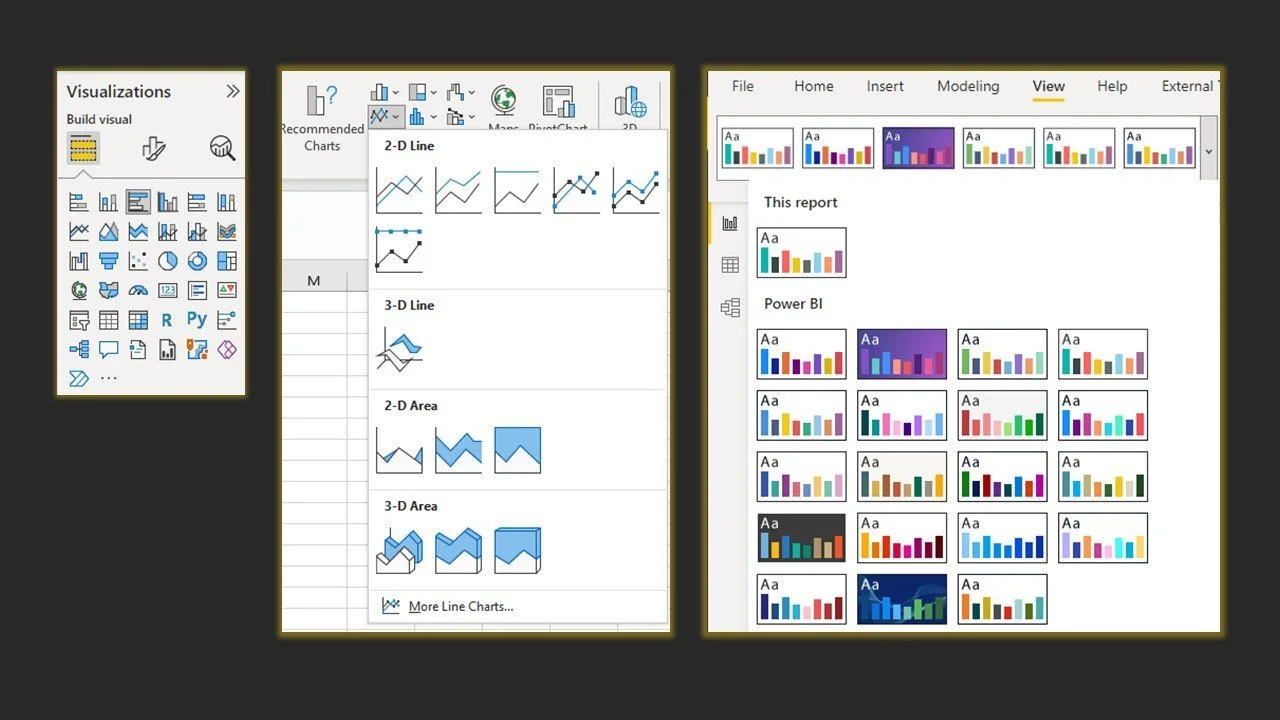
The Chart Selector Icons in Excel Ribbon are Much Larger and Easier to Use.
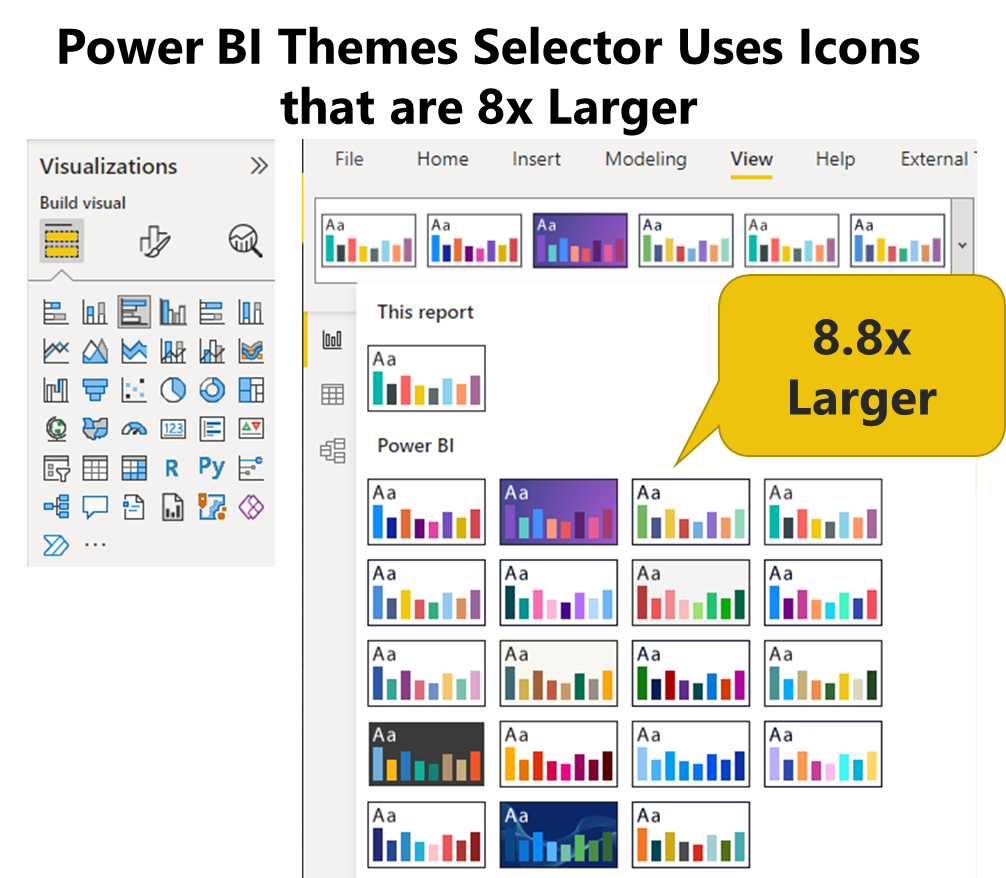
In fact, I feel there is one place where Power BI has already borrowed from the Office/Excel Ribbon interface. The gorgeous “Themes Selector”. With large, easy to see and use icons.
Vote for Idea: Large Chart Type Icons in Power BI
May be you have had the same struggle as me.
Or may be, after reading all this, you just want to help a guy out :-)
Either way, I would really appreciate if you clicked the link below and cast a vote for this idea:

How to Ask Good Power BI Questions❓ & Get Them Answered✔️
This article has the following sections:
Part I - The Problem
You are stuck!
You are stuck trying to make a DAX Measure work
Or Your Visuals are just not behaving! Argh!
Or you have another technical Power BI Question
I sometimes joke with my kids that "Google is God!", implying it knows everything.
But when you are stuck late in your office (or home office), trying to find that answer, it certainly doesn't feel that way.
Google gives you LOTS of answers...just not
yours!

So you finally decide to ask others for help.
But ★where★ should you ask for help? And ★how★ should you ask for help?

It's quite possible, you have tried asking for help before, but had only been disappointed.
This article will teach you, how you can ask good Power BI questions❓...and get them answered✔️
Ready? Let's go.
Part II - Where to Ask for Help
You could go on...
Option 1: Power BI Community Forums
And other similar forums on the web (there are lots and lots of them!). These can be hit or miss.
Option 2: LearnPowerBI Private Community
This is a private community, exclusively for members of the LearnPowerBI Program.
➕ Advantages:
✔ This has a more selected group of individuals (since this is an exclusive community)
✔ That may make you more comfortable in asking questions inside this closed, private group
✔ Everyone is part of the same program, and is grounded in the same LearnPowerBI principles. So you are more likely to get consistent advice you can trust
✔ Avi (that's me 😃) can step in to assist with questions wherever needed
⛔ Disadvantages:
— Some times it can be hard 😰 to explain your problem on a forum. And that's when the next option, may be the best one :-)
Option 3: Power BI Q&A Live Zoom Call
(Best Option! 💛)
We host LIVE Power BI Q&A Calls on Zoom, and this can have several advantages.

➕ Advantages:
✔ On a live call you can just talk to someone and explain your problem
✔ You can easily share your screen and/or files if needed*
✔ You can work together on the LIVE Call to find a solution ✅
* Of course, we don't recommend you share any sensitive data without an NDA. So if you do have sensitive data either hide it, use dummy data or anonymize it. Or just hire a Consultant.
To learn more about the LIVE Power BI Q&A Calls on Zoom, just click here.
Bonus Option: Hire an Expert Power BI Consultant
If you are looking for immediate help from an expert, in a completely private setting, where you can safely share your private data and files, consider hiring a Power BI Consultant
_____________________________
But whether you are posting your question on a forum, or asking in a live session; you still need to ask your question ❓ the right way (by including the right elements) to improve your chances of getting an answer ✔️
Part III - How to Ask Your Power BI Question (So They Get Answered)
Including one or more of these elements, when asking your question, could greatly increase the chances of you getting an answer.
Question Text: Explain your question in words
Annotated Screenshot
Attached File (Excel or Power BI File)
Recorded Video or Live Screen Sharing
Including these elements can help you get your Power BI Question Answered ✔️. Keep reading to learn exactly how to do that.

Level 1: Question Text Only
You may get an answer, but probability may be low :-(
Here's what Level 1 May Look Like:
I am showing sales by month.
I would like to show the "Average Monthly Sales" for the selected period.

I can show Total Sales (Sum of Sales).
But I tried switching that to Average and that gives a very different number :-(

I am stumped, please help.
Level 2: Question + Annotated Screenshot
A picture is worth a thousand words :-)
A Useful Tip here:
Besides pointing out what is NOT working
Also specify what the right answer or behavior should be
See Video below 👇 on "How to Create Annotated Screenshots" and scroll down further to see an example of an annotated screenshot.
Here's what Level 2 May Look Like, with the Annotated Screenshot:
I am showing sales by month.
I would like to show the "Average Monthly Sales" for the selected period.
👉 See Screenshot below.

I can show Total Sales (Sum of Sales).
But I tried switching that to Average and that gives a very different number :-(

I am stumped, please help.
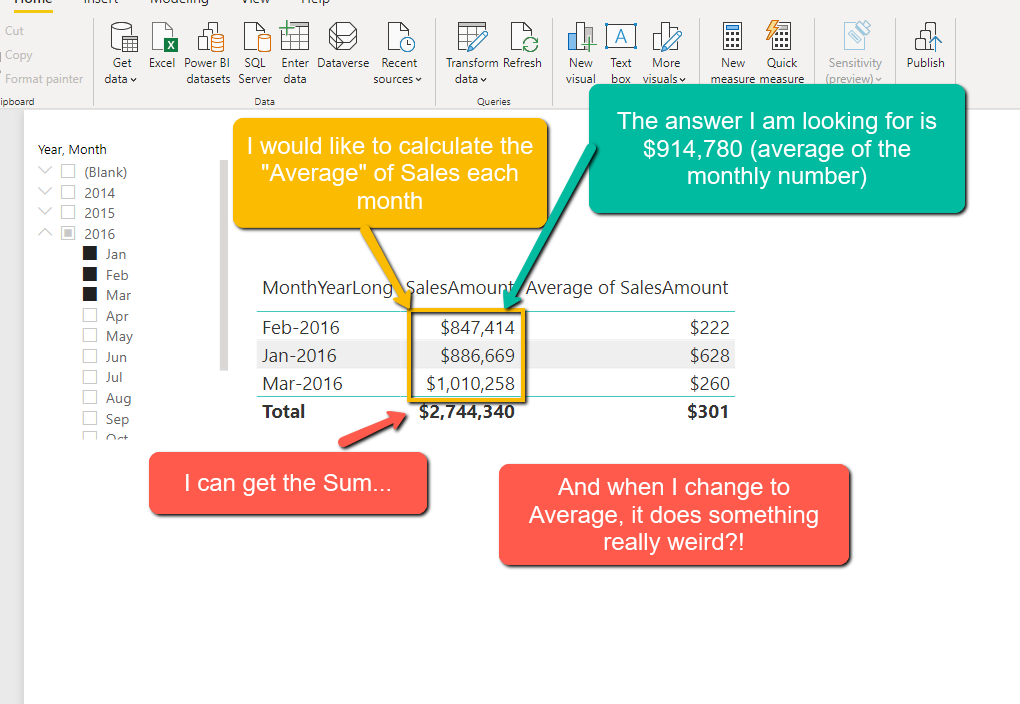
Level 3: Question + Annotated Screenshot + Attached File
Adding a file, makes it much easier for someone to step in and help.
You can either include
Power BI File (see earlier note about sharing sensitive data)
Excel File with Some Input Data or Sample Data
Usually the easiest ways to actually "attach" the file, is to upload it to Google Drive / One Drive / Dropbox etc. and create a "Shared Link"
Here's what Level 3 May Look Like:
I am showing sales by month.
I would like to show the "Average Monthly Sales" for the selected period.
👉 See Linked File & Screenshot below.

I can show Total Sales (Sum of Sales).
But I tried switching that to Average and that gives a very different number :-(


I am stumped, please help.

Level 4: Question + Attached File + Recorded Video or Live Screen Sharing
If a picture is worth a thousand words, a video is worth? Ha! Quite a bit. Videos can be really helpful.
Recorded Video of you walking through the problem (see example below, recorded using Loom)
Live Screen Sharing with the Person trying to help you and walk them through the problem. The big advantage here of course is
They can ask for clarification
They can take over screen control to guide you
You may be able to see them solve the problem in real time. Thus not only getting the answer, but also understanding their approach to problem solving
As I mentioned before, that's exactly why we host LIVE Q&A calls inside our Learn Power BI Training Program.
* As we also said before, we don't recommend you share any sensitive data without an NDA. So if you do have sensitive data either hide it, use dummy data or anonymize it. Or just hire a Consultant.
Here's what Level 4 May Look Like:
I am showing sales by month.
I would like to show the "Average Monthly Sales" for the selected period.
👉 See Linked File & Video below.

I can show Total Sales (Sum of Sales).
But I tried switching that to Average and that gives a very different number :-(


I am stumped, please help.
Recap
I am not saying that every single time you have a question you should do all those things.
But just understand that including these additional elements, may increase the probability of your question getting answered
Question Text: Explain your question in words
Annotated Screenshot
Attached File (Excel or Power BI File)
Recorded Video or Live Screen Sharing
How to Contact Me
Send a Message from the Contact Me page
Send me a Message on LinkedIn
Or just email me at avi@avising.com
As always...
⚡Power On!⚡ / Avi